Whenever a summer drought limits forage production, nitrates can accumulate in plants. Adequate forages are essential for feeding ruminants and other herbivores. Forages provide an excellent source of nutrients, fiber for proper rumen function, and make use of renewable forage resources. Corn silage produced under drought conditions is often low in energy. Feeding drought-stressed forage high in nitrates is challenging, but with good management and some proper precautions can be successful.
Forage nitrate accumulation is most commonly seen in corn silage, but can occur in other plants as well.
| Plants known to | Plants believed not to |
| accumulate nitrates | accumulate nitrates |
| Corn/corn silage | Alfalfa |
| Johnson grass | Fescue |
| Ryegrass | Orchardgrass |
| Small grains | Timothy |
| Sorghum | Bermuda grass |
| Sudangrass | Native grasses |
| Some weeds (Pigweed) |
Nitrates are most likely to accumulate when plants are stressed. This may coincide with high nitrate levels in the soil after release of nitrates from organic matter or manure, or as a result of heavy applications of fertilizer. During periods of drought plants will continue to take up nitrate, but moisture stress will reduce conversion of nitrate into protein in the plant. Anything that reduces the rate of plant photosynthesis or protein biosynthesis will result in greater nitrate accumulation; frost, low temperatures, cloudy weather, and herbicide applications can all result in greater plant nitrate accumulation.
Since moisture is required for nitrate uptake, the greatest nitrate accumulation during a drought will occur following rainfall. When this happens, forage should not be harvested at that time nor should animals be allowed graze. Concentrations of nitrates are generally highest in stalk tissues and lower in leaves and vegetative tissues. One strategy for management is to set forage harvesters to cut higher on the stalk so that higher nitrate material is not harvested.
Ruminant animals convert nitrate to nitrite and then to ammonia in the rumen and detoxify the nitrate. But, if nitrate levels are high enough, nitrite will accumulate in the rumen and be absorbed through the wall of the rumen into the blood supply. When this happens nitrite combines with hemoglobin in the blood and converts it to methemoglobin, which will carry little oxygen to the tissues. When methemoglobin reaches toxic levels death occurs due to oxygen deprivation.
Contact your veterinarian if you suspect nitrate toxicity. The only reliable method to determine if nitrates are a problem is to test the forage in question. Contact your local County Extension Agent or the New Jersey Department of Agriculture Division of Animal Health for more information.
Pointers for Forages and Feeding Management when Nitrate is a Concern
1. Avoid the application of high amounts of nitrogen fertilizer or manure late in the season to avoid increased nitrate uptake and plant accumulation.
2. Harvest when nitrate accumulation decreases in plants, typically as plants mature.
3. When harvesting raise the cutter bar to avoid higher nitrate levels in the lower stalk (about 8-10 inches); the greatest level of nitrate accumulation is in the lower stalk.
4. Don’t allow animals to graze and don’t harvest forages following heavy rains. After a heavy rain is often the period of greatest nitrate uptake.
5. Pay attention to proper silage management, moisture content, packing, and length. Drought-damaged corn can be chopped at ¼ to ⅜ inch in length. The silo should be filled quickly and packed as tightly as possible in order to exclude oxygen.
6. Order of feeding priority: Silage > Hay > Grazing > Greenchop. Ensiling will destroy 40-60% of nitrates. Therefore, silage crops will have the lowest levels of nitrate due to bacterial destruction. Producing forage for dry hay does not destroy nitrates. Greenchop will be the most risky to feed. If nitrate levels are high enough, ensiling may be the only way to salvage the forage.
7. Never feed forage containing greater than 1.5% nitrate. Ruminants can be adapted to high nitrate levels by slowly increasing the level of nitrate containing forage in the diet. Animals can be fed forage containing <1.5% nitrate if slowly adapted and provided the forage is only a portion of the diet.
8. Mix with other feeds when feeding. Diluting with concentrates and nitrate-free forages can help accomplish this.
9. When grazing nitrate-containing forages, feed animals prior to turning out to graze to ensure dilution of nitrates.
10. Fall freezing can cause increased nitrate uptake.
11. Use of a silage inoculant during ensiling may increase the destruction of nitrate.
12. Supplement with Vitamin A. Previous research has shown that forage containing high levels of nitrate may be low in vitamin A or with reduced Vitamin A availability.
13. Test water supplies for nitrates.
14. Test forages whenever nitrate accumulation is likely due to drought.
Some of the information in this article was taken from Rutgers Cooperative Extension Bulletin E291 Nitrate Management.
For more information see:
Nitrate QuikTest for Rapid Detection of High Nitrate Levels in Forages
Progressive Cattleman: Nitrate Contamination in Cover Crops
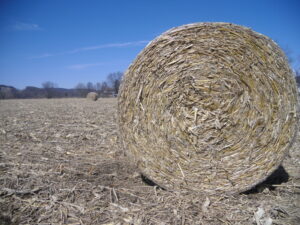 Here is a checklist of questions to ask and sellers to answer to ensure the fodder purchased is fit for livestock consumption and priced accordingly.
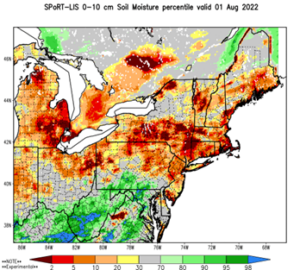
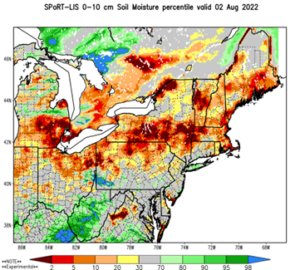 , soil moisture for surface to ten cm depth readings shifted from below the 3-percentile category for much of the county on August 1st to the 30th percentile as of August 2, but a large area of production remains in the five to ten percentile.